Social and Climate Vulnerability Framework Project

To address this, the Hawaii State Climate Commission partnered with the University of Hawaii at Mānoa, stakeholders, and community to produce the Social Vulnerability to Climate Change in Hawaii: Data, Indicators, and “Gap” Assessment. The report identifies current research and tools to identify social vulnerability and climate hazard exposure. The project has resulted in two key recommendations: 

The Hawaii State Climate Commission recognizes that although climate change negatively affects all of us, some communities face disproportionate impacts through no fault of their own. Factors such as demographics, socioeconomic status, and limited access to resources can make it much harder to prepare for and recover from climate change. Because of these conditions, events such as extreme weather, sea level rise, heatwaves, flooding, and erosion might prove a hazard for some, but a disaster for others. 

Assessing the Need

To address this, the Hawaii State Climate Commission partnered with the University of Hawaii at Mānoa, stakeholders, and community to produce the Social Vulnerability to Climate Change in Hawaii: Data, Indicators, and “Gap” Assessment. The report identifies current research and tools to identify social vulnerability and climate hazard exposure. The project has resulted in two key recommendations: 

To address this, the Hawaii State Climate Commission partnered with the University of Hawaii at Mānoa, stakeholders, and community to produce the Social Vulnerability to Climate Change in Hawaii: Data, Indicators, and “Gap” Assessment. The report identifies current research and tools to identify social vulnerability and climate hazard exposure. The project has resulted in two key recommendations: 

  1. The creation of a comprehensive, user-friendly data portal on social vulnerability and climate change. Accessible information will support decision-makers, non-profits, and community leaders in addressing social vulnerability throughout their work.                                                                                                                                                                                           
  2. The creation of a pilot program to work with relevant departments and commission entities for the operationalization of social vulnerability considerations into planning and decision-making.

INDICATORS OF THE DISADVANTAGED COMMUNITY AS IDENTIFIED BY THE Interim Implementation Guidance for the Justice40 Initiative

In the Justice40 Initiative, the President directs his agencies to invest 40% of total federal funding to “disadvantaged, marginalized, underserved, and overburdened” communities, including federal programs that provide services like affordable housing, workforce development, and those working to address climate change.

In collaboration with the University of Hawaii we developed this quick guide so that agencies could consider appropriate data, indices, and screening tools to determine whether a specific community is disadvantaged based on a combination of variables that may include, but are not limited to, the following:

o Low income, high and/or persistent poverty 

o High unemployment and underemployment 

o Racial and ethnic residential segregation, particularly where the segregation stems from discrimination by government entities 

o Linguistic isolation 

o High housing cost burden and substandard housing

o Distressed neighborhoods 

o High transportation cost burden and/or low transportation access 


o Disproportionate environmental stressor burden and high cumulative impacts 

o Limited water and sanitation access and affordability 

o Disproportionate impacts from climate change 

o High energy cost burden and low energy access 

o Jobs lost through the energy transition 

o Access to healthcare


DISTRESSED NEIGHBORHOODS 


HOUSING COSTS 


EMPLOYMENT


ENERGY BURDEN AND ACCESS 


ENVIRONMENTAL STRESSOR


HEALTH CARE ACCESS

       Climate Change Social Vulnerability Guide 

Percent of people under 65 years of age without health insurance 

  • State of Hawaiʻi : 5 %
    • Kauaʻi County: 5.2%
    • Honolulu County: 4.4%
    • Maui County: 5.9%
    • Hawaiʻi County: 5.6% 

    SOURCE:

    U.S. Census Bureau – QuickFacts (QuickFacts provides statistics for all states and counties, and for cities and towns with a population of 5,000 or more.)

    To find more data about a specific county, click the link and use the search bar in the top left to find your county. 

    • QuickFacts uses data from the following sources:
      • National level – Current Population Survey, Annual Social and Economic Supplement (CPS ASEC)
      • State level – American Community Survey (ACS), one-year estimates
      • County level – The Small Area Health Insurance Estimates (SAHIE), one-year estimates
      • Sub-county level: Cities, towns and census designated places; – ACS, five-year estimates
      • Puerto Rico and its municipios (county-equivalents for Puerto Rico) and its sub-counties (zonas urbanas and comunidades); Puerto Rico Community Survey (PRCS), five-year estimates.


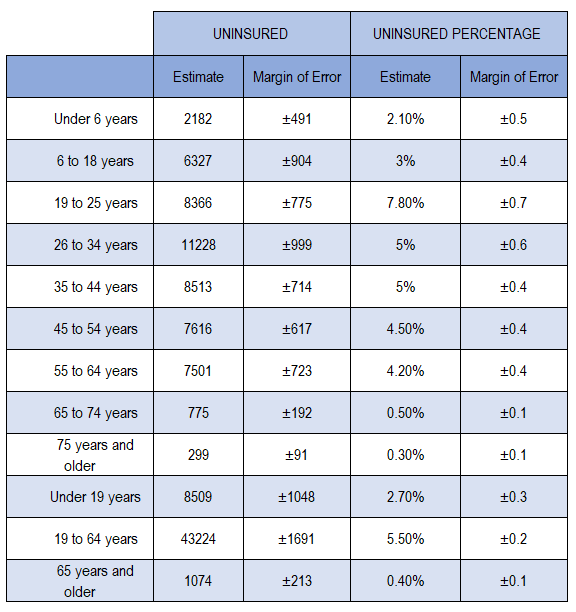
    SOURCE: American Community Survey (2020: ACS 5-Year Estimates Subject Table) 

    The American Community Survey (ACS) is an ongoing survey that provides vital information on a yearly basis about our nation and its people. Information from the survey generates data that help determine how more than $675 billion in federal and state funds are distributed each year.

    Data are based on a sample and are subject to sampling variability. The degree of uncertainty for an estimate arising from sampling variability is represented through the use of a margin of error. The value shown here is the 90 percent margin of error. The margin of error can be interpreted roughly as providing a 90 percent probability that the interval defined by the estimate minus the margin of error and the estimate plus the margin of error (the lower and upper confidence bounds) contains the true value. In addition to sampling variability, the ACS estimates are subject to nonsampling error (for a discussion of nonsampling variability, see ACS Technical Documentation). The effect of nonsampling error is not represented in these tables.

    Number of hospitals 

     State of Hawaiʻi :  29 

    Kauaʻi County: 3

    Honolulu County: 16

    Maui County: 4

    Hawaiʻi County: 6

    Number of hospital beds 

     State of Hawaiʻi :  3,030 

    Kauaʻi County: 111

    Honolulu County: 2,339

    Maui County:  247

    Hawaiʻi County: 33

    *As of November 2021

    SOURCE:  State Department of Health, Office of Health Care Assurance (OHCA)

    Link to full data table from Hawaii Statewide GIS Program

    Health Professional Shortage Area Story Map Series 

    A Health Professional Shortage Area (HPSA) means any of the following which has a shortage of health professionals: (a) an urban or rural area which is a rational service area for the delivery of health services, (b) a population group, or (c) a public or nonprofit private medical facility.  

    There are 7 layers to overlay with this story map. 

    1. Health Care Facilities 
    2. Primary Care Health Professional Shortage Area 
    3. Mental Health Professional Shortage Area
    4. Dental Health Professional Shortage Area
    5. Medically Underserved Areas (MUA’s)
    6. Medically Underserved Populations (MUP)
    7. Health Care Service Area 

    SOURCE: State of Hawaii, Department of Health 

              Other Data 

    Medically Underserved Areas/Populations are areas or populations designated by US Health Resources & Services Administration as having too few primary care providers, high infant mortality, high poverty or a high elderly population. 

    SOURCE: EPA EJScreen

    What is EJScreen?

    EJScreen is an environmental justice mapping and screening tool that provides EPA with a nationally consistent dataset and approach for combining environmental and demographic indicators. EJScreen users choose a geographic area; the tool then provides demographic and environmental information for that area. All of the EJScreen indicators are publicly-available data. EJScreen simply provides a way to display this information and includes a method for combining environmental and demographic indicators into EJ indexes. 


    IMPACTS FROM CLIMATE CHANGE 


      LINGUISTIC ISOLATION


    LOW INCOME 


     RACIAL AND ETHNICITY

    Race/origin by census block*

    2020 Census Hawaiian Homelands

    *Native Hawaiian; Insufficient data (Native Hawaiian and other Pacific Islander is a combined dataset in the census race/origin data)


    TRANSPORTATION COST BURDEN 


    WATER AND SANITATION ACCESS 

    Disclaimer: This information is intended to be used as a guide and resource for general informational purposes only.  Neither the State of Hawai‘i nor any agency thereof, nor any of their employees assumes any legal liability or responsibility for the accuracy, completeness, or usefulness of any information, or represents that its use would not infringe privately owned rights. Reference herein to any specific projects, or organizations does not constitute or imply  endorsement, recommendation, or favoring by the State of Hawai‘i government or any agency thereof. The views and opinions of authors expressed herein do not necessarily state or reflect those of the State of Hawai‘i government or any agency thereof. 

    ACKNOWLEDGEMENTS

    Mahalo nui loa to Makena Coffman, Suwan Shen, and Maja Schjervheim from our UH Mānoa Team at the UH Institute for Sustainability and Resilience for their expertise and guidance throughout this project’s development.